|
Heating season
|
Oct 7, 2008
|
|
I hate these first few weeks of fall where the temperature drops at night but is almost comfortable during the day, leaving me on the fence about whether to turn the heat on or not. I realize that once I turn it on, I won't turn it off until like May. It means my electric bill will septuple in size (x7, quite literally). It means winter is upon us, which is never fun. So I make the decision to sit around with my jacket on, keep my hands warm by sitting on them, freeze my butt off when I get out of the shower, and generate heat by putting the blanket over my head in bed, all for the purpose of delaying heating season. #science
|
|
Unusual deaths
|
Oct 3, 2008
|
|
Wikipedia has an excellent list of unusual deaths. Too many to quote. #health
|
|
Pleasurable necessities
|
Oct 3, 2008
|
|
This is just an observation, not a commentary: Humans tend to turn necessities into sources of pleasure. For example, the three or four basic necessities for human survival are food/water, clothing, and shelter (though I think I could survive without clothing; regardless, that's a separate post). Instead of just eating food to give us sustenance, we eat to enjoy it. We go to restaurants, we eat candy and cake, and we choose our foods based on what will give us the most pleasure. It's the same with drinks. Instead of just drinking the bare minimum of water, we have drinks to speed us up, drinks to slow us down, and drinks that provide extra nourishment to make up for the foods we eat. Clothing probably represents the largest disconnect between form and function. How many of us dress to simply cover our bodies? Instead, most people dress to make themselves look thinner or more muscular or taller or to showcase their ability to tan. And our shelters don't just shelter us. We paint the walls, hang up pictures, and buy duvet covers to make our homes more homey. I wonder what life would be like if we only satisfied our necessities. #psychology
|
|
DVOA
|
Oct 1, 2008
|
The current method of quantifying the performance of NFL quarterbacks is with the much-aligned Passer Rating. It's calculated with typical quarterback stats, including completion percentage, yards per completion, touchdowns, etc. However, it has two glaring downfalls: (1) It ranges from 0 to an obscure 158.3, and (2) it consistently ranks bad quarterbacks quite highly.
A new statistic called Defense-adjusted Value Over Average has been developed that seeks to avoid these pitfalls. It's based on a percent scale, making it easy for normal people to understand what's good and bad. If a quarterback's passer rating is 95, is that good? Who knows? With the DVOA, it's easy to see that a value of 100% is good while a value of 50% is not (although DVOA uses negative percentages, which to me seems to defeat the purpose of using percentages). Also, a quarterback like Donovan McNabb, who traditionally has a high quarterback rating, is ranked lower with DVOA (sorry there's no proof for that; it was in a Popular Science magazine article).
Personally, I'd like to develop my own rating system that takes into account whether the team won or lost. Because when it comes down to it, the best quarterback on a losing team is still on a losing team. #sports
|
|
Netherlands (1)
|
Oct 1, 2008
|
|
The Netherlands is a confusing country. Sometimes it's called Holland. But its people are Dutch. Dutch sounds like Deutsch, as in Deutschland, which refers to Germany, but which Americans butchered and further confused by developing terms like "Pennsylvania Dutch" (which should really be "Pennsylvania Deutsch" since the people are of German descent). Holland is technically an area in the central-western part of the Netherlands, but the term "Holland" is often used to refer to the country as a whole (pars pro toto). In addition to describing the people from the Netherlands, the term "Dutch" also refers to a language spoken not only in Holland, but also in neighboring Belgium, France, and a few other places. #travel
|
|
Auto-ordered plates (10)
|
Oct 1, 2008
|
If there was ever a doubt as to how much of a geek I am, this should make it clear.
Our household owns several different colors of solid-color plates. Two each of red, orange, yellow, and blue. We use these plates in a random order, i.e. we don't intentionally use plates of the same color for a meal for two. Furthermore, the order of the plates is constantly changing (and randomly, at that) because the order in which they're used isn't the order in which they're replaced, and sometimes newly washed plates are placed on top of the pile, while other times they're placed at the bottom. If anything can be said about the usage of these plates, it's that it's completely random. There's no order involved whatsoever. Which makes it interesting when something like this happens:
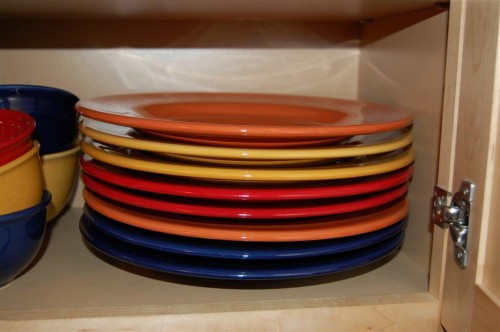
What we have here is a set of eight plates that have almost grouped themselves by color. Two blues, one orange, two reds, two yellows, one orange. There's most likely a way to calculate the probability of something like this happening, though I don't claim to understand probability. What's equally interesting is that this isn't the first time it's happened. It happened at least one other time in the last few months, which would make that probability even more amazing. The day the plates completely auto-order themselves will most likely be the day the world ends. If not, I'll post that picture too. #math
|
|